The Net Position is the financial position of the City – assets and deferred outflows of resources less liabilities and deferred inflows of resources.
Condensed Statement of Net Position
Table values in billions of dollars
Fiscal Year 2017
Total City Assets: $63.0 billion
Deferred Outflows of Resources: $4.5 billion

Assets represent what the City owns
• Cash and pooled investments
• Receivables
• Capital assets (land, buildings and infrastructure)
Total City Liabilities: $44.7 billion
Deferred Inflows of Resources: $1.8 billion
 Liabilities represent what the City owes
• Bonds and notes
• Claims and judgments
• Unearned revenue
• Accounts payable and accrued expenses
Net Position: $21.0 billion ⬆ $1.1 billion (5.6%) from Fiscal Year 2016
The net position of $21.0 billion consisted of:
• Net investment in capital assets: $18.2 billion, e.g. land, building, infrastructure and equipment less accumulated depreciation and outstanding debt related to acquisition, construction, or improvements ($5.4 billion in governmental activities, $12.9 billion in business-type activities).
• Restricted net position: $5.9 billion, which represents external restrictions imposed by creditors, grantors, contributors, laws of other governments, constitutional provisions or enabling legislation ($2.5 billion in governmental activities, $3.4 billion in business-type activities).
• Unrestricted Net position: $3.1 billion deficit due to the City’s pensions and other long-term obligations ($6.6 billion deficit in governmental activities, $3.5 billion in business-type activities).
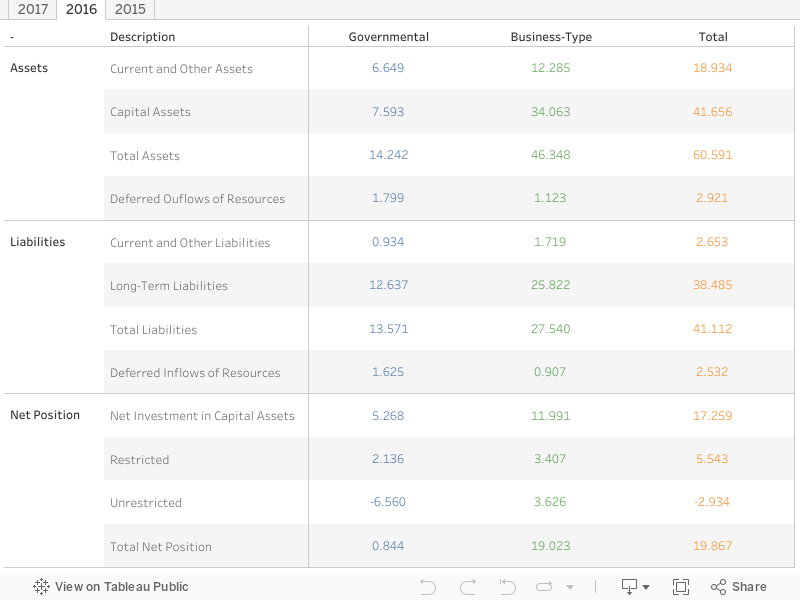
Fiscal Year 2016
Total City Assets: $60.1 billion
Deferred Outflows of Resources: $2.9 billion
Total City Liabilities: $41.1 billion
Deferred Inflows of Resources: $2.5 billion
Net Position: $19.9 billion ⬆ $2.3 billion (13.0%) from Fiscal Year 2015
The net position of $19.9 billion consisted of:
• Net investment in capital assets: $17.3 billion, e.g. land, building, infrastructure and equipment less accumulated depreciation and outstanding debt related to acquisition, construction, or improvements ($5.3 billion in governmental activities, $12.0 billion in business-type activities).
• Restricted net position: $5.5 billion, which represents external restrictions imposed by creditors, grantors, contributors, laws of other governments, constitutional provisions or enabling legislation ($2.1 billion in governmental activities, $3.4 billion in business-type activities).
• Unrestricted Net position: $2.9 billion deficit due to the City’s pensions and other long-term obligations ($6.6 billion deficit in governmental activities, $3.6 billion in business-type activities).