The General Fund is the general operating fund of the City and includes transactions of the Reserve Fund and other accounts that have General Fund type activity for generally accepted accounting principles (GAAP) reporting purposes. At June 30, 2017, the General Fund reported a total fund balance of $886.2 million, composed of $45.5 million nonspendable from inventories of $33.2 million, and certain advances to other funds of $12.3 million; $9.7 million committed; $304.5 million assigned for general government purposes; and $526.5 million unassigned. View the Management’s Discussion and Analysis for more information about Governmental and Business-Type Activities ▸
In fiscal year 2017, General Fund revenues exceeded expenditures by $166.2 million.
Revenues and Expenditures
Use the tabs to toggle between charts of revenues and expenditure, and scroll down to the discussion of changes between fiscal years.
 FY 2017 Total Revenues: $5.01 billion
⬆ 2.3% from FY 2016
Chart values in thousands of dollars. Click to toggle between years. View Data ▸
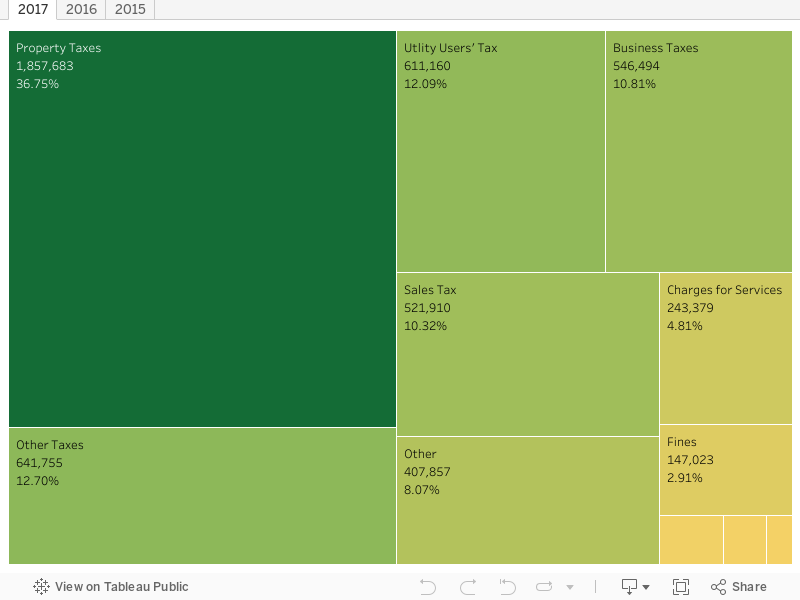
Revenues in Fiscal Year 2017
Overall tax revenues grew $223.9 million or 5.7% from fiscal year 2016 as a result of the sustained modest growth in the economy.
Total taxes accounted for nearly $4.2 billion (83.5%) of General Fund revenue.
Total property taxes, which represent 37.1% of General Fund revenue, increased by $149.5 million (8.8%).
Mainly due to higher current secured property tax receipts of $59.9 million, increase in Community Redevelopment Agency (CRA) property tax increment of $47.6 million from the sale of former CRA properties, and higher vehicle license fee replacement receipts of $25.2 million.
Economy-sensitive revenues reflect the steady improvement in the economy.
Sales tax revenues grew $84.1 million or 19.2% due to the restoration of the 1% local tax rate resulting from the unwinding of the State’s triple flip. The increase in business tax revenues of $38.9 million or 7.7% is reflective of the steady growth in business activities despite the net effect of the City’s phased-in tax reduction to the top business tax rate.
Utility users’ tax revenues posted a net decrease of $3.7 million (0.6%).
Primarily due to lower accruals of telephone users’ tax revenue from the continued decline in landline usage as consumers opted for less costly voice and texting plans.
Other tax revenues were up $55.4 million or 9.4%
Mainly due to $39.4 million increase in transient occupancy tax driven by increased lodging and occupancy demand, $15.0 million higher documentary transfer tax attributed to home price appreciation from limited housing inventory, and $1.0 million increase in parking occupancy tax.
Licenses and permits slightly went up by $4.4 million (13.5%).
Mainly due to sustained growth in construction activities during the fiscal year that resulted in higher revenues earned from building material permit fees of $1.1 million, $1.8 million increase in lateral shoring support shoring fees and increase of $1.5 million in miscellaneous permits and fees.
Charges for services decreased by $75.1 million (23.6%).
This was due to the reclassification of revenues resulting from interdepartmental charges as credits to the appropriate expense accounts instead of revenues. Intergovernmental revenues decreased by $5.4 million or 25.9% due mainly to lower receipts from state mandated program grants.
Net investment earnings were down by $37.3 million
Caused by the decline in fair value of investments in fiscal year 2017 offset by earnings from higher available cash balance.
Revenues in Fiscal Year 2016
Total taxes accounted for nearly $4.0 billion or 80.8% of General Fund revenue.
Overall tax revenues grew $158.2 million or 4.2% from fiscal year 2015 as a result of the sustained modest growth in the economy.
Total property taxes, which represent 34.9% of the General Fund revenue, increased by $96.5 million (6.0%).
Mainly due to higher current secured property tax receipts of $68.7 million, increased vehicle license fee replacement receipts of $25.9 million, and $7.3 million increased receipts from current secured supplemental taxes, current unsecured taxes and miscellaneous other property tax adjustments. These increases were offset by $5.4 million decrease in interest and penalties on delinquent tax receipts of $1.7 million and lower collections from prior secured property tax redemption.
Sales tax revenues grew $65.0 million (17.4%).
As a result of the unwinding of the State’s triple flip, while business tax revenues were slightly up by $6.9 million or 1.4%.
Utility users’ tax revenues posted a decrease of $22.5 million (3.5%).
Primarily due to lower natural gas prices and continued decline in landline usage as consumers opted for less costly voice and texting plans.
Other tax revenues were up $33.8 million (6.1%).
Mainly due to $27.9 million increase in transient occupancy tax driven by increased lodging and occupancy demand, and $10.8 million higher parking occupancy tax. These increases were offset by $2.9 million decreased franchise revenues.
Licenses and permits went up by $10.1 million (44.8%).
Mainly due to the robust construction activities during the fiscal year that resulted in significant revenues earned from B permit fees. Charges for services were $299.0 million lower due to the reclassification of revenues resulting from interdepartmental charges as credits to the appropriate expense accounts instead of revenues. Intergovernmental revenues decreased by $18.6 million or 47.3% due mainly to an unanticipated one- time receipt of mandated reimbursements from the State in the prior fiscal year.
Investment earnings increased by $18.2 million (87.6%).
Due to a rise in fair value and earnings on investments and higher available cash balance.
 FY 2017 Total Expenditures: $4.84 billion
⬆ 5.8% from FY 2016
Chart values in thousands of dollars. Click to toggle between years. View Data ▸
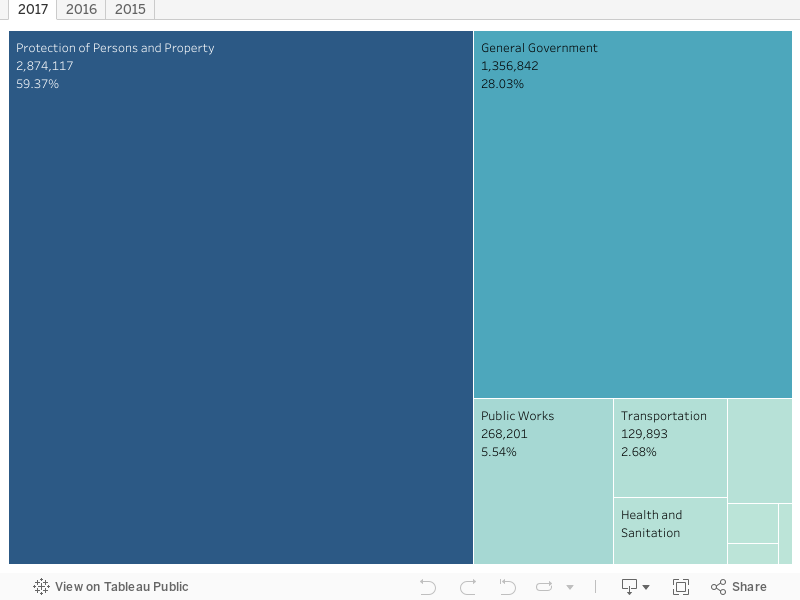
Expenditures in the Fiscal Year 2017
General Fund expenditures were $4.8 billion, an increase $266.4 million (5.8%) from fiscal year 2016.
As in the previous fiscal year, interfund reimbursements of $426.7 million (pertaining to repayments mainly from special funds to the General Fund for particular expenditures that it initially paid for them) were treated as reductions from expenditures of the General Fund instead of being credited as revenues. These accounted for decreases in expenditures as discussed below.
General government expenditures posted a $40.7 million increase (3.1%).
Due to $31.6 million higher salaries, benefits, health insurance and workers compensation costs. Allocated share of the general government in liability claims and LACERS pension cost of $18.9 million and $16.6 million respectively also accounted for the increase. These increases were offset by a reduction of $29.5 million interfund payments.
Protection of persons and property expenditures grew by $76.4 million or 2.7%
Due to $63.3 higher salaries and benefits, $14.9 million and $11.9 million higher police and fire contractual services respectively, and $2.7 million acquisition of fire and police operating equipment and supplies. These increases were offset by a lower share in allocated liability claims of $15.7 million.
Increases of $105.4 million in salaries, benefits,health insurance subsidies, COLA adjustments mainly accounted for the $155.7 million higher public works expenditures.
Additional increases were $33.1 million in liability claims payout, $6.9 million higher utility expenses, $2.5 million acquisition of construction equipment and supplies, and $12.4 million allocated share in pension costs. These increases were offset by $4.6 million reduction from interfund payments.
Health and Sanitation declined by $43.7 million and Cultural and Recreational Services by $45.6 million.
Reductions of expenses were related to interfund reimbursements.
Transportation expenses were $24.5 million higher.
Mainly due to increases of $8.3 million in salaries, benefits, and contractual services, $17.7 million in liability claims and $5.3 million allocated share in pension costs. These were offset by a reduction of interfund reimbursements of $6.9 million.
Community development expenses were $76.6 million higher.
Due to outlays incurred in granting subsidies to outside organizations for community projects of $43.8 million, $22.3 million increase in liability claims and $9.8 million higher salaries and contractual services.
Expenditures in Fiscal Year 2016
General Fund expenditures were $4.6 billion, a decrease $116.0 million (2.5%) from fiscal year 2015.
interfund reimbursements of $334.3 million (pertaining to repayments mainly from special funds to the General Fund for particular expenditures that it initially paid for them) were treated as reductions from expenditures of the General Fund instead of being credited as revenues. These accounted for decreases in expenditures as discussed below.
General government expenditures posted a $17.3 million net decrease (1.3%).
Increases of $93.4 million or 7.0% were primarily due to $29.2 million increase in liability claims, $15.3 million higher contractual services, $8.3 million increase in civilian pension cost, $10.4 million increase in workers compensation, and $54.8 million higher salaries, benefits and health insurance due to MOU negotiated changes during the fiscal year. These increases were offset by a reduction of $110.7 million interfund repayments.
Protection of persons and property expenditures grew by $64.4 million (2.3%).
Mainly due to $39.3 higher salaries and benefits, $13.4 million acquisition of fire and police operating equipment and supplies, and $11.7 million increase in liability claims. The $64.4 million increase was offset by $38.2 million reduction from interfund repayments, thereby resulting in a net increase of $26.2 million or 0.9%.
Increases of $23.6 million in health and sanitation, $24.4 million in transportation, and $6.5 million in cultural and recreational services were offset by reductions from expenses.
These reductions were attributed to interfund reimbursements of $45.3 million in public works, $66.3 million in health and sanitation, $29.4 million in transportation, and $3.7 million in cultural and recreational services. $40.9 million of expenditures from interfund repayments were deducted from community development which also posted a slight decrease of $0.7 million in expenditures during the fiscal year.